Saturday 23 July 2011

Here are a few important terms that we use in this documentation:
Series
A related set of data in a chart. What constitutes a series depends on the chart type: in a line chart, a series is a single line; in a pie chart, each entry is a slice, and all slices together are a series. In a bar chart, a series is all the bars from the same set of data; different series are either grouped side by side or stacked atop each other, depending on the bar chart type. The following chart demonstrates a grouped bar chart with two series, one in dark blue, one in light blue:
Bar chart showing two series: Cats and Dogs.
Axis labels
Numeric or text values along each axis. In the previous chart, it would be the labels "Jan," "Feb," "Mar," "0," "50," "100."
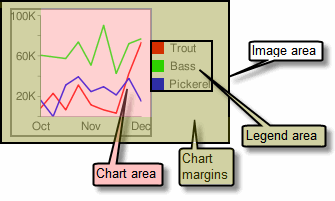
Various regions of a chart.
Chart area
The area showing the series art. See "Chart Components" sidebar for more details.
Legend
A small area on the chart describing the series. In the chart above, it is the section that lists "Cats" and "Dogs".
Parameter
key=value pair used in the URL. For example: chxt=x, where chxt is the parameter name and x is the parameter value.
GET and POST
Two methods of sending your Chart URL. GET is typically done either by typing a URL in the browser, or by making it the source of an <img> tag. POST requests are more complex to make, but can include much more data. The main reason to use POST instead of GET is that a POST request can take much more data than a GET request (16K characters vs 2K characters). POST is covered here.
Pipe character
The | character, often used as a parameter value delimiter—that is, a character to break up multiple values. Commas and ampersands (&) are also used as delimiters in the Chart URL.
Compound charts
A chart that is a combination of two different chart types: for example, a bar chart with a line, or a line chart with candlestick markers. See Compound Charts.

0 comments:

About Me

About Me !

Glossary of Chart Terms

| Saturday 23 July 2011 |


Here are a few important terms that we use in this documentation:
Series
A related set of data in a chart. What constitutes a series depends on the chart type: in a line chart, a series is a single line; in a pie chart, each entry is a slice, and all slices together are a series. In a bar chart, a series is all the bars from the same set of data; different series are either grouped side by side or stacked atop each other, depending on the bar chart type. The following chart demonstrates a grouped bar chart with two series, one in dark blue, one in light blue:
Bar chart showing two series: Cats and Dogs.
Axis labels
Numeric or text values along each axis. In the previous chart, it would be the labels "Jan," "Feb," "Mar," "0," "50," "100."
Various regions of a chart.
Chart area
The area showing the series art. See "Chart Components" sidebar for more details.
Legend
A small area on the chart describing the series. In the chart above, it is the section that lists "Cats" and "Dogs".
Parameter
key=value pair used in the URL. For example: chxt=x, where chxt is the parameter name and x is the parameter value.
GET and POST
Two methods of sending your Chart URL. GET is typically done either by typing a URL in the browser, or by making it the source of an <img> tag. POST requests are more complex to make, but can include much more data. The main reason to use POST instead of GET is that a POST request can take much more data than a GET request (16K characters vs 2K characters). POST is covered here.
Pipe character
The | character, often used as a parameter value delimiter—that is, a character to break up multiple values. Commas and ampersands (&) are also used as delimiters in the Chart URL.
Compound charts
A chart that is a combination of two different chart types: for example, a bar chart with a line, or a line chart with candlestick markers. See Compound Charts.


0 comments:

Post a Comment

Lorem ipsume